Some Napari Basics#
The examples in this workshop make use of some of my personal ‘helper’ and ‘widget’ libraries. These are all built on the concept of Napari ROIs, Layers and labelling tools.
For those interested in starting to learn the Napari API and building your own ‘helper’ libraries, this notebook shows how to use these tools directly from Napari.
from skimage.io import imread
import os
import napari
import matplotlib.pyplot as plt
import numpy as np
data_path = r'../../data'
parent_path = os.path.join(data_path, 'ladybugs_series')
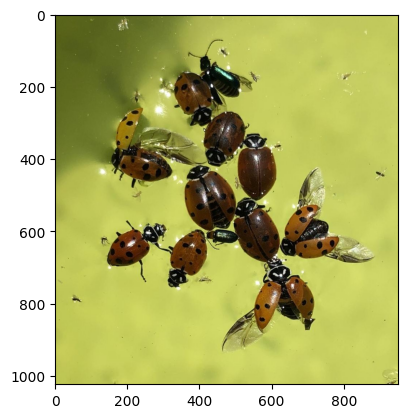
img = imread(os.path.join(parent_path, '26638467_41374651.jpg'))
plt.imshow(img)
<matplotlib.image.AxesImage at 0x1d0cad1c760>
Start Napari viewer and add several layers#
viewer = napari.Viewer()

labels = np.zeros([img.shape[0], img.shape[1]], dtype=np.uint16)

viewer.add_image(img, name='ladybug')
viewer.add_labels(labels, name='labels')
rois_layer = viewer.add_shapes(face_color='transparent', edge_width=15, edge_color='blue', name='rois')

box = [[100,100], [100,500],[500,500], [500,100]]
rois_layer.add_rectangles(box)
Create a Cellpose cyto3 model…#
… and add a layer for Cellose results
from cellpose import models, io
model_cyto3 = models.CellposeModel(gpu=True, model_type="cyto3")

results = np.zeros([img.shape[0], img.shape[1]], dtype=np.uint16)
viewer.add_labels(results, name='cyto3 masks')
<Labels layer 'cyto3 masks' at 0x1d11026e920>
Call Cellpose …#
… and update the Cellpose layer
results = model_cyto3.eval(img, diameter=140)
viewer.layers['cyto3 masks'].data = results[0]
WARNING: more than 2 channels given, use 'channels' input for specifying channels - just using first 2 channels to run processing
Get the ROI and labels we drew in Napari#
roi = viewer.layers['rois'].data
print(type(roi))
print(len(roi))
print(roi[0])
roi = np.array(roi[0], dtype=np.int16)
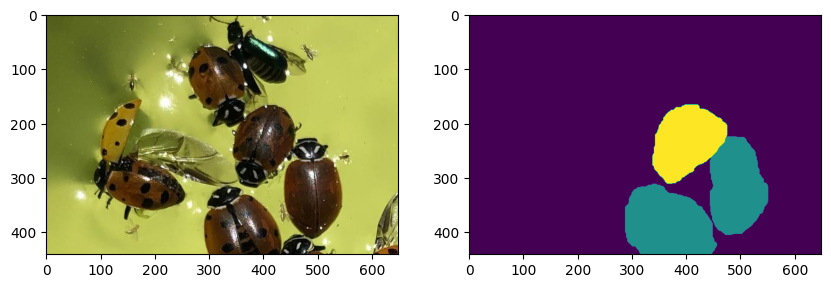
crop = img[ roi[0][0]:roi[2][0], roi[0][1]:roi[1][1]]
crop_label = labels[roi[0][0]:roi[2][0], roi[0][1]:roi[1][1]]
plt.figure(figsize=(10,5))
plt.subplot(1,2,1)
plt.imshow(crop)
plt.subplot(1,2,2)
plt.imshow(crop_label)
<class 'list'>
1
[[103.55742401  68.2272757 ]
 [103.55742401 717.98806052]
 [544.32298732 717.98806052]
 [544.32298732  68.2272757 ]]
<matplotlib.image.AxesImage at 0x23c8b3a9b10>